

Functionality Pack
Reporting & Analytics
Leverage the advantages of a single unified platform to get your project data working for you

Connected, real-time data at your fingertips
Whether you're using one module or many, your data in Simpel is real-time and can be analysed any time. Put it to use to gain valuable operational insights and guide your business operations.
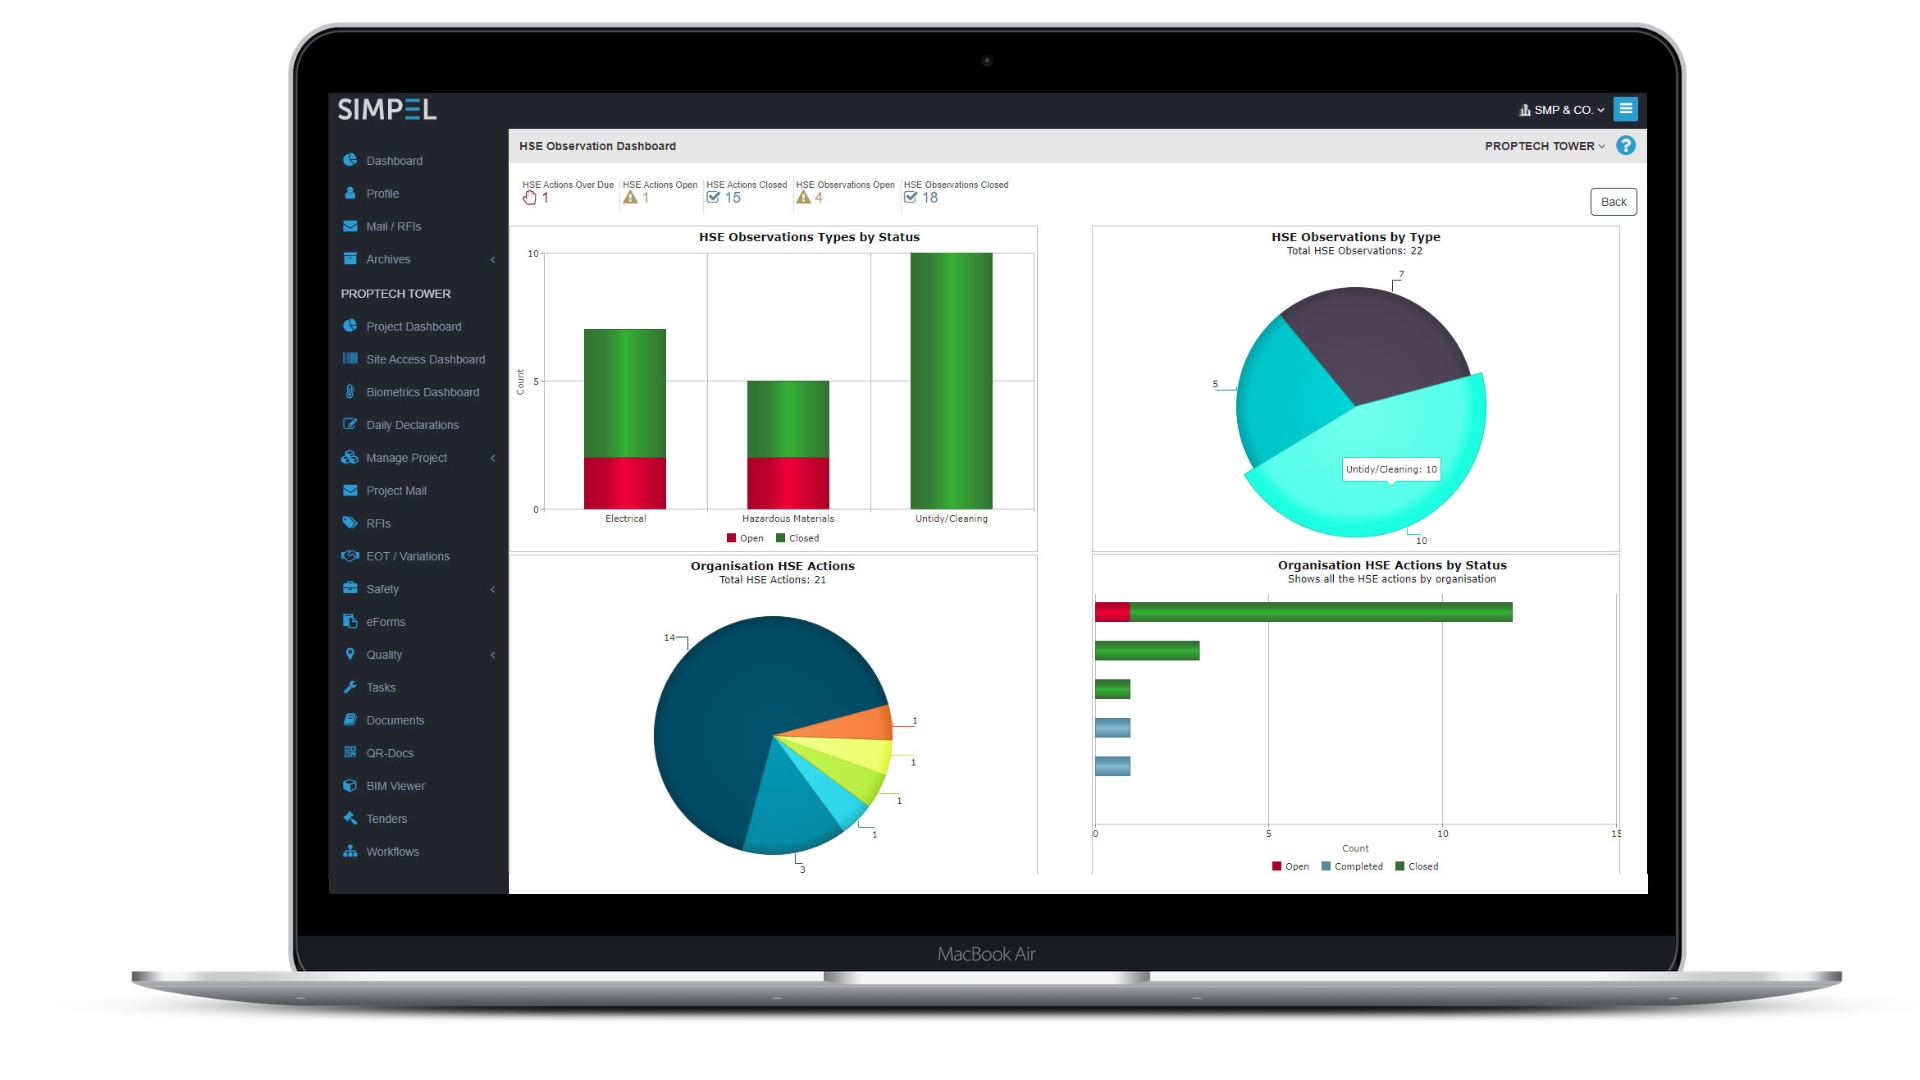
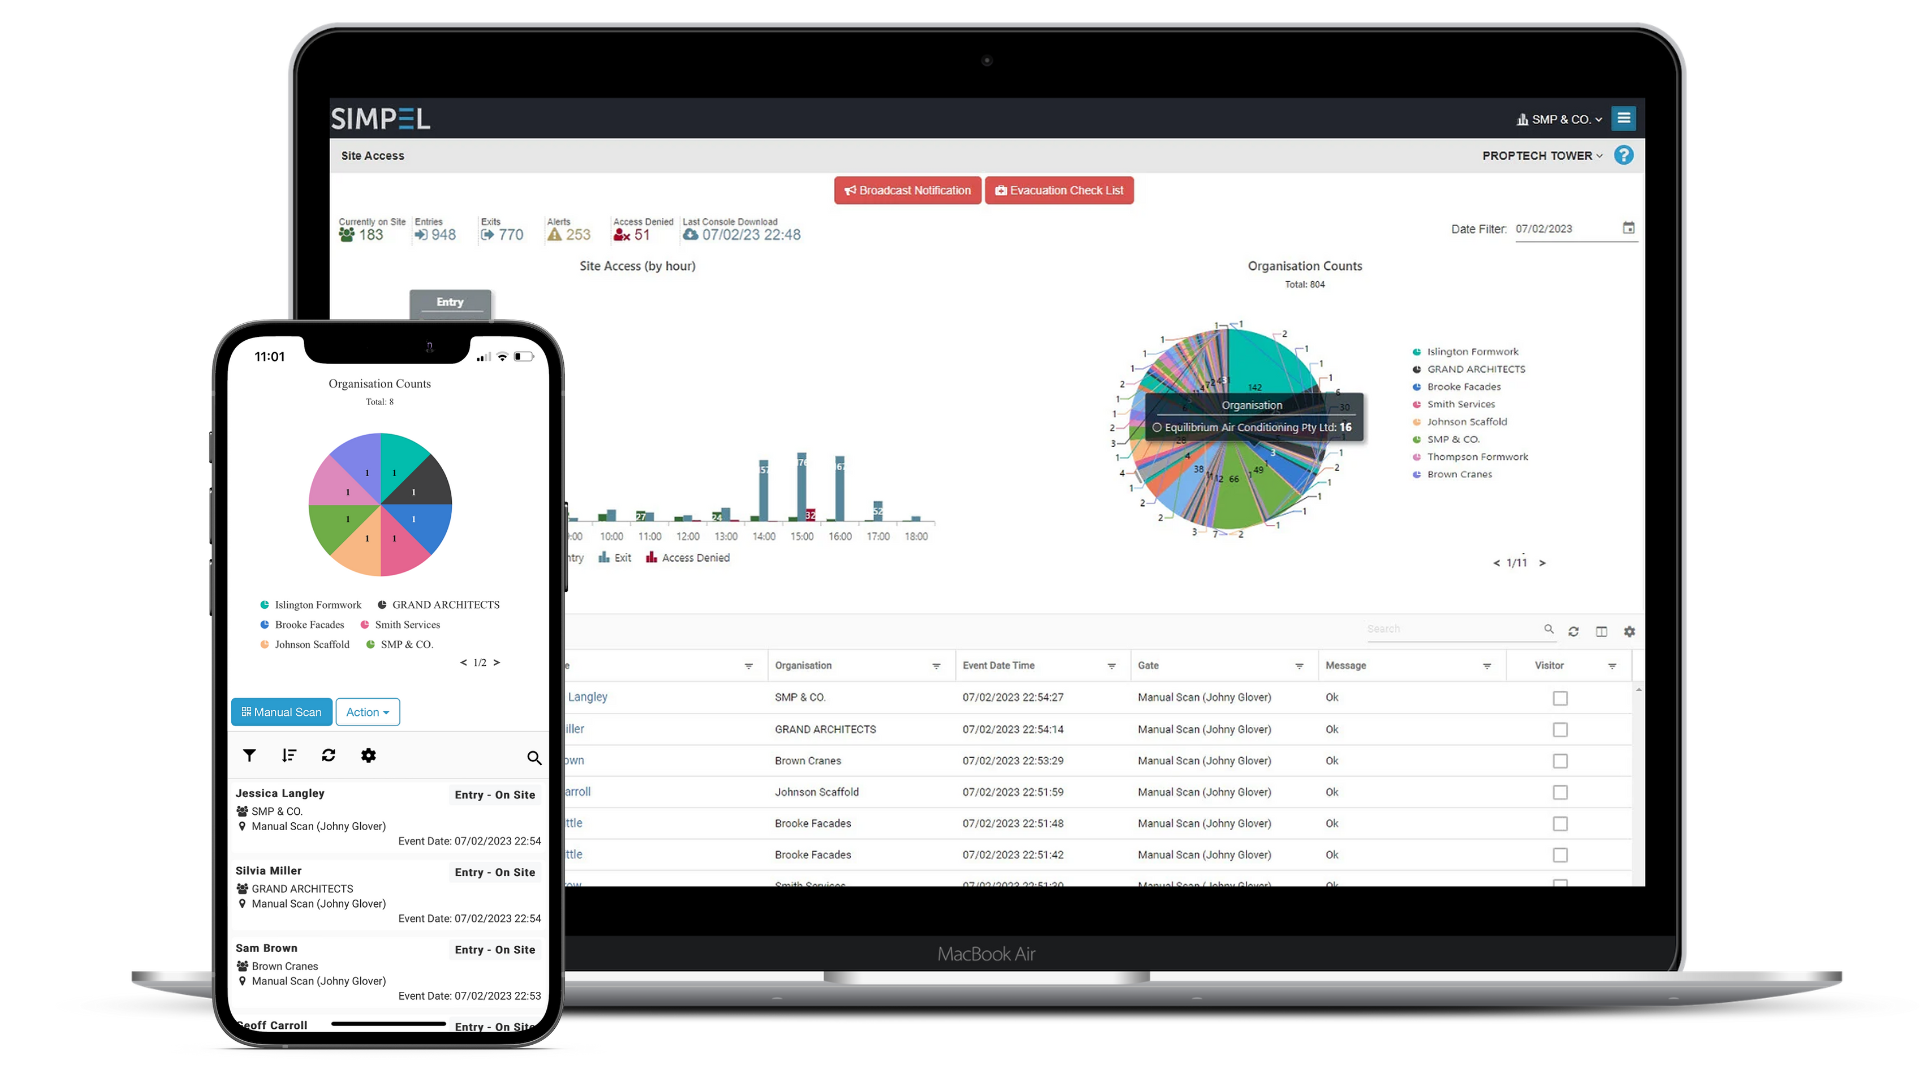
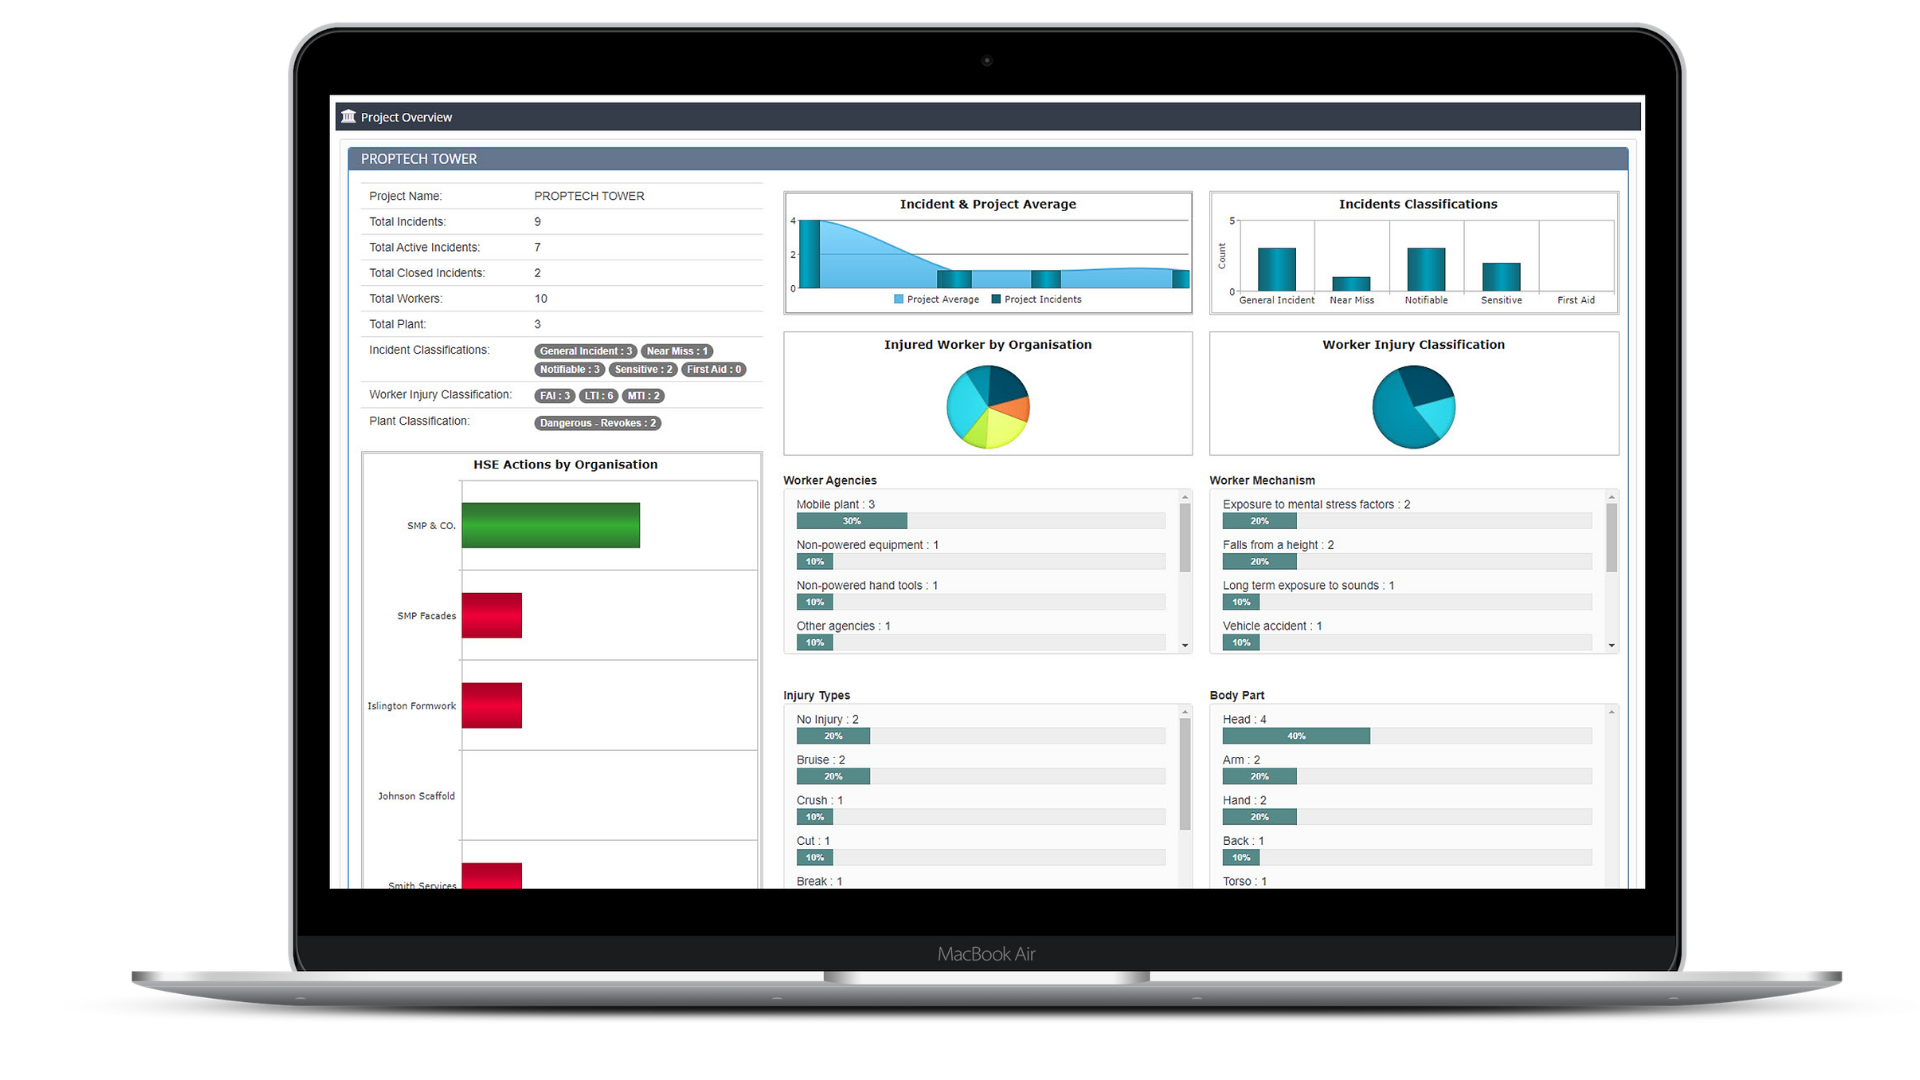
Dashboards and Data Charts
Dashboards provide immediate project and organisational insights derived from data within each module. Compile accurate datasets and key metrics for specific parameters and time periods - whether it's a single day, week, month or the entire project lifecycle.
Features
- Key operational counts, work patterns and trends are available for analysis to help measure performance and improve productivity
- Raw data and reports branded with your logo can be printed, and are suitable for internal or client reporting

BI Data Exports
Harness the power of your data! Utilise your preferred business intelligence tools to identify and analyse trends.
Features
- Extract key real-time data across all modules instantly - no need to contact Simpel to request your data export
- Isolate data at the project, organisation, company or modular level
- Select the data set and export via CSV file
- Useful for internal or client reporting purposes